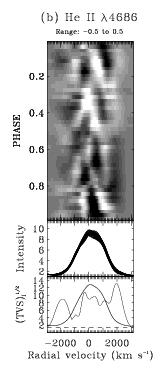
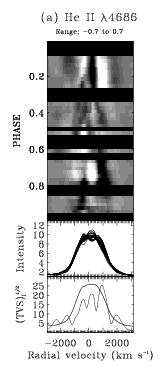
Gray-scale plots for WR 6 of He II 4686 in January 1991 (left panel) and January 1995 (right panel). The individual profiles minus the mean profile of the epoch are ordered as a function of phase (P=3.766 days). This figure illustrates the recurrent nature of the variations on a weekly basis (over 2 and 3 weeks, respectively) but the lack of coherency over longer timescales.